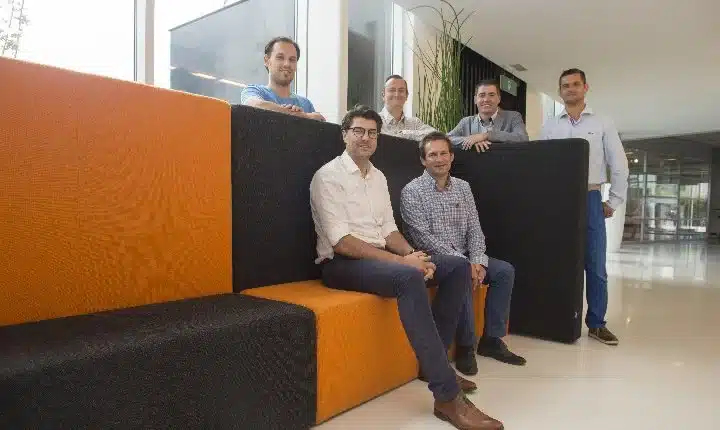
The House of HR asked Kohera to design an architecture and step-by-step plan to build a system that can perform dynamic and visually attractive analyses quickly. This system also needed to be easily expandable to respond to possible future requirements.
Structure for everything
Projects like this bring challenges with them, and the The House of HR is still in full development mode. ‘The more our organisation grows, the more our needs grow too,’ starts Peter Ingelbrecht, CIO at The House of HR. ‘We opted for Microsoft Power BI but our biggest challenge was with its associated data structure. How did we need to organise it? What infrastructure did we have to set up?’
This is why The House of HR decided to call on Kohera’s services. ‘We met Kohera at a Delta Light client event,’ continues Peter Ingelbrecht. ‘It appeared they didn’t just have the right knowledge and expertise in house; they also used a similar working method to ours. We want to progress quickly, and not get stuck in planning and discussions, and we clicked very well with Kohera on that front. That was the deciding factor for us.’

Clear action plan with a view to the future
The House of HR was very certain about where it wanted to get to and what requirements the new system had to satisfy. ‘There was a lot of historical information available within Accent, but our tools were quite static with limited analysis options. We wanted to grow into a situation where employees could work with dynamic and visually attractive data, so were looking for a kind of self-service BI. The biggest challenge was to build something that was also future proof,’ says Peter Ingelbrecht. ‘It wasn’t fully clear to us what we had to do to enable this.’
Kohera started by drawing up an approach plan. ‘This project is a collection of smaller projects, and the last projects haven’t been defined yet,’ explains Nico Verbaenen, BI Architect at Kohera. ‘We looked at what was possible in terms of usefulness and difficulty, and then looked for some middle ground between what was future proof and what we could set up quickly. This led us to a roadmap with different phases in which we first established the structures, then chose the tools, and finally delivered. We arrived at three projects which would offer us more insights into the sales, turnover and KPIs which lead to success.’

Dynamic and flexible architecture
The project was initially set up for Accent Jobs and then extended to other departments in The House of HR one step at a time. ‘This didn’t make things easy. We had to build something generic that was also dynamic and future proof for dealing with issues that we weren’t aware of yet,’ says Jonathan Verpoort, BI Consultant at Kohera. ‘The biggest job was the architecture which we split into two sections, with all the information from the various source systems on one hand, and the data warehousing and reporting on the other. In contrast to traditional static data warehousing, we made sure short-term changes were possible. We positioned a virtual layer between the two sections so we could set up a new version of the data warehouse every day. It’s not a problem for this structure if a new department is added.”
Reports tailored to the user
Accent Jobs has 800 users who all need their own information. ‘The office consultants need operational data but also look at the sales and KPIs that interest their office. The office staff perform in-depth analyses to set budgets and draw up commercial plans, and there are regional representatives who manage multiple offices,’ says Roel Bäumer, BI Project Lead at The House of HR. ‘The higher you go in the company, the greater the need for more detailed data.’
But not everyone uses Power BI. Peter Ingelbrecht: ‘Most users want to see a fixed set of info every day or month. We use Microsoft Reporting Services for this so people can look at semi-operational info via filters in a more or less fixed structure. Then you also have people like the management team, who just want to look up key figures for certain aspects quickly and easily. We visualise this using the mobile reports and KPIs feature in Microsoft Reporting Services, so we’re using the full set of reporting options that Microsoft offers.’
‘There’s better integration between the data and the operations,’ adds Diederik Sohier, CFO for The House of HR. ‘It’s good to know the sales figures for the office networks, but even better to know what they’re comprised of. With Power BI you can look up detailed figures and make flexible variations of data sets, which used to be much more difficult. Our analysts used to spend 80-90% of their time looking up data, but now this time is spent analysing, comparing and predicting.’

Do it yourself after delivery
The House of HR project represents a long-term partnership for Kohera. Nico Verbaenen: ’Because of the project’s short timespan, we got started straight away. Together with the client we looked at what they wanted to achieve by when, and what tools would be best for this. I then started working internally with my team by training employees up and sharing knowledge along the way. We delivered sufficient information and documentation after each phase for them to be able to work on it themselves afterwards. We are of course continuing to provide support and advice where necessary.’
| Cookie | Duration | Description |
|---|---|---|
| ARRAffinity | session | ARRAffinity cookie is set by Azure app service, and allows the service to choose the right instance established by a user to deliver subsequent requests made by that user. |
| ARRAffinitySameSite | session | This cookie is set by Windows Azure cloud, and is used for load balancing to make sure the visitor page requests are routed to the same server in any browsing session. |
| cookielawinfo-checkbox-advertisement | 1 year | Set by the GDPR Cookie Consent plugin, this cookie records the user consent for the cookies in the "Advertisement" category. |
| cookielawinfo-checkbox-analytics | 11 months | This cookie is set by GDPR Cookie Consent plugin. The cookie is used to store the user consent for the cookies in the category "Analytics". |
| cookielawinfo-checkbox-functional | 11 months | The cookie is set by GDPR cookie consent to record the user consent for the cookies in the category "Functional". |
| cookielawinfo-checkbox-necessary | 11 months | This cookie is set by GDPR Cookie Consent plugin. The cookies is used to store the user consent for the cookies in the category "Necessary". |
| cookielawinfo-checkbox-others | 11 months | This cookie is set by GDPR Cookie Consent plugin. The cookie is used to store the user consent for the cookies in the category "Other. |
| cookielawinfo-checkbox-performance | 11 months | This cookie is set by GDPR Cookie Consent plugin. The cookie is used to store the user consent for the cookies in the category "Performance". |
| CookieLawInfoConsent | 1 year | CookieYes sets this cookie to record the default button state of the corresponding category and the status of CCPA. It works only in coordination with the primary cookie. |
| elementor | never | The website's WordPress theme uses this cookie. It allows the website owner to implement or change the website's content in real-time. |
| viewed_cookie_policy | 11 months | The cookie is set by the GDPR Cookie Consent plugin and is used to store whether or not user has consented to the use of cookies. It does not store any personal data. |
| Cookie | Duration | Description |
|---|---|---|
| __cf_bm | 30 minutes | Cloudflare set the cookie to support Cloudflare Bot Management. |
| pll_language | 1 year | Polylang sets this cookie to remember the language the user selects when returning to the website and get the language information when unavailable in another way. |
| Cookie | Duration | Description |
|---|---|---|
| _ga | 1 year 1 month 4 days | Google Analytics sets this cookie to calculate visitor, session and campaign data and track site usage for the site's analytics report. The cookie stores information anonymously and assigns a randomly generated number to recognise unique visitors. |
| _ga_* | 1 year 1 month 4 days | Google Analytics sets this cookie to store and count page views. |
| _gat_gtag_UA_* | 1 minute | Google Analytics sets this cookie to store a unique user ID. |
| _gid | 1 day | Google Analytics sets this cookie to store information on how visitors use a website while also creating an analytics report of the website's performance. Some of the collected data includes the number of visitors, their source, and the pages they visit anonymously. |
| ai_session | 30 minutes | This is a unique anonymous session identifier cookie set by Microsoft Application Insights software to gather statistical usage and telemetry data for apps built on the Azure cloud platform. |
| CONSENT | 2 years | YouTube sets this cookie via embedded YouTube videos and registers anonymous statistical data. |
| vuid | 1 year 1 month 4 days | Vimeo installs this cookie to collect tracking information by setting a unique ID to embed videos on the website. |
| Cookie | Duration | Description |
|---|---|---|
| ai_user | 1 year | Microsoft Azure sets this cookie as a unique user identifier cookie, enabling counting of the number of users accessing the application over time. |
| VISITOR_INFO1_LIVE | 5 months 27 days | YouTube sets this cookie to measure bandwidth, determining whether the user gets the new or old player interface. |
| YSC | session | Youtube sets this cookie to track the views of embedded videos on Youtube pages. |
| yt-remote-connected-devices | never | YouTube sets this cookie to store the user's video preferences using embedded YouTube videos. |
| yt-remote-device-id | never | YouTube sets this cookie to store the user's video preferences using embedded YouTube videos. |
| yt.innertube::nextId | never | YouTube sets this cookie to register a unique ID to store data on what videos from YouTube the user has seen. |
| yt.innertube::requests | never | YouTube sets this cookie to register a unique ID to store data on what videos from YouTube the user has seen. |
| Cookie | Duration | Description |
|---|---|---|
| WFESessionId | session | No description available. |