
Allocating budgets on a different level is not easy to manage in DAX. It was (and still is) a DAX struggle for me.
This blog post will guide you through the different steps I took to easily manage the different granularities (and write easy DAX afterwards) by allocating budget on day level using Power Query.
I created several sales reports, but in order to get a complete view and gain more insights in the figures, I had to include the budget figures.
The customer provided excel budget files, but these files were created using different aggregation levels. The source files were weekly budgets for department A and monthly budgets for department B. Reporting on the other side required weekly and monthly analysis for both departments.
As you might have noticed, a week can contain dates of multiple months, e.g. Sunday 29 September to Saturday 5 October contains 2 days of September and 5 days from October.
When we look at a month on the other side, we can have problems on both sides of the month. The first week of the month can contain dates from the previous month and the last week of the month can contain dates from the next month.
As we can conclude, budget allocation handling different granularities is inevitable.

As I like to play with DAX, I started writing different formulas, but never achieved the correct result. The only solution I knew would work was to change my dataset using Power Query. The below steps will provide you an easy way to handle this difference in granularities.
Step overview
Let’s dive into the details
Let’s start by loading the budget data into you Power BI model.
Make sure you have at least the following columns:
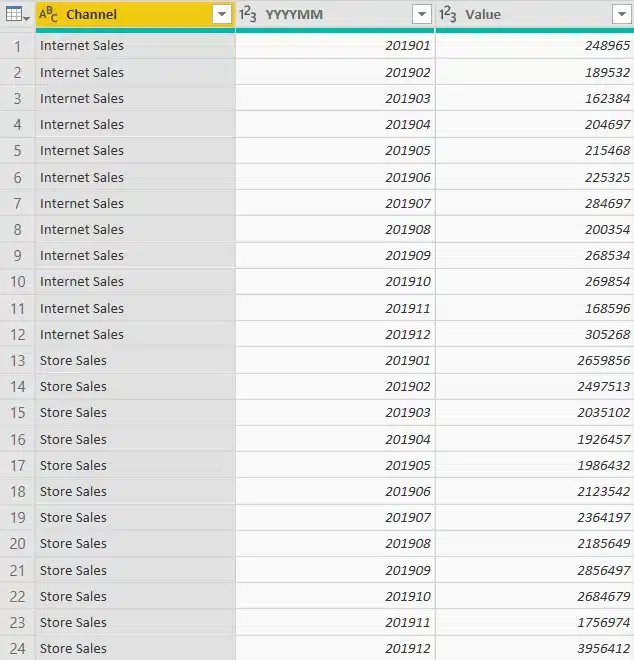
Example: a monthly budget file
Generate a calendar table.
Make sure this table also contains the ‘YYYYMM’ and ‘YYYYWW’ columns.
We only allocated budget to working days, so we added an additional column: ‘IsWorkingDay’ (1= working day, 0 = non working day). You might need to create your own logic for this depending on holidays, weekends,…
| = if [IsWeekend] = false and [IsHoliday] = false then 1 else 0 |
Using the calendar table generated before, we now create an aggregated table to determine the number of working days by month or by week (depending on the use case). We needed both so generated 2 additional tables, one by month and another one by week.
To achieve this, right click the calendar table and choose ‘reference’.
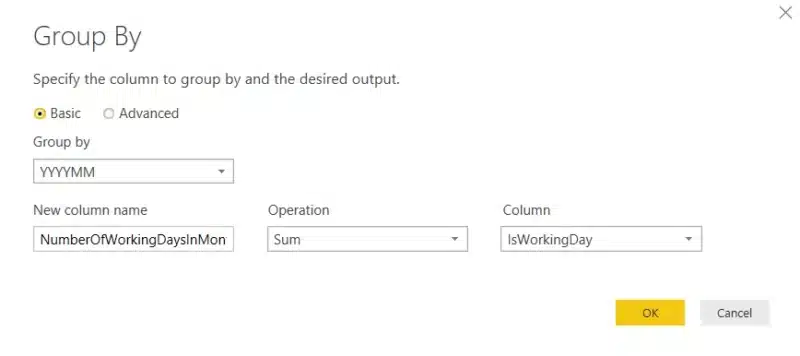
Next use the ‘group by’ functionality and group by YYYYMM or YYYYWW and as aggregation add: SUM(IsWorkingday) as NumberOfWorkingDaysInMonth/Week
The YYYYMM or YYYYWW column is required to link the budget table with the aggregated calendar table.
This will generate a 2 columns table, one indicating the month or week, and another the number of working days in that period.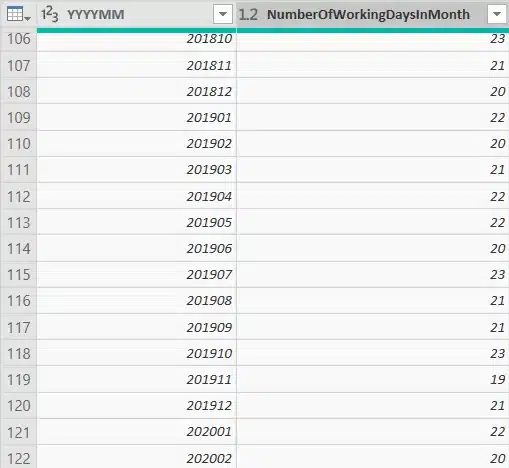
To determine the budget per day, we merge the budget table with the aggregated calendar table.
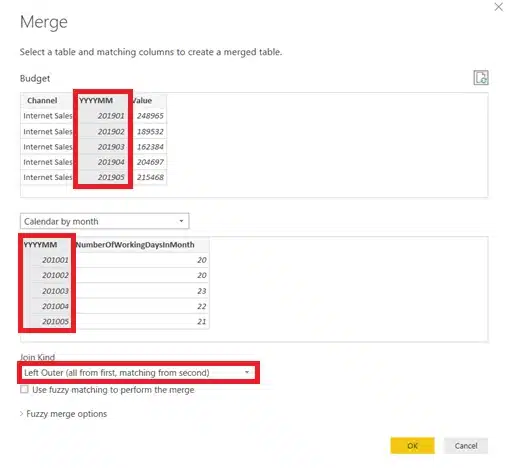
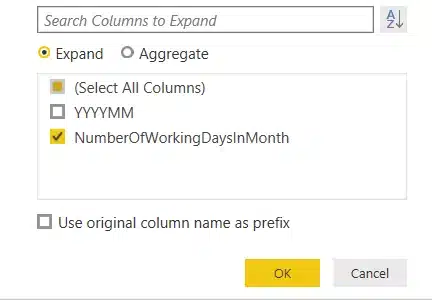
To add columns for the merged table, simply click the expand icon and select the column to add.
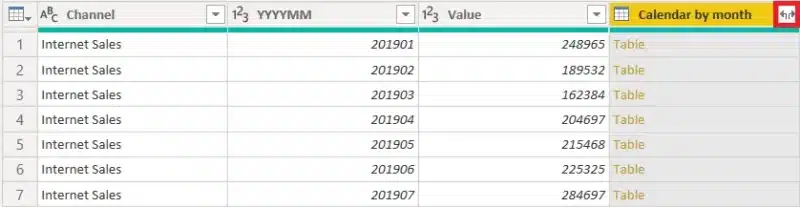
After this merge we now have the following columns
To get the DayValue we simply add a custom column.
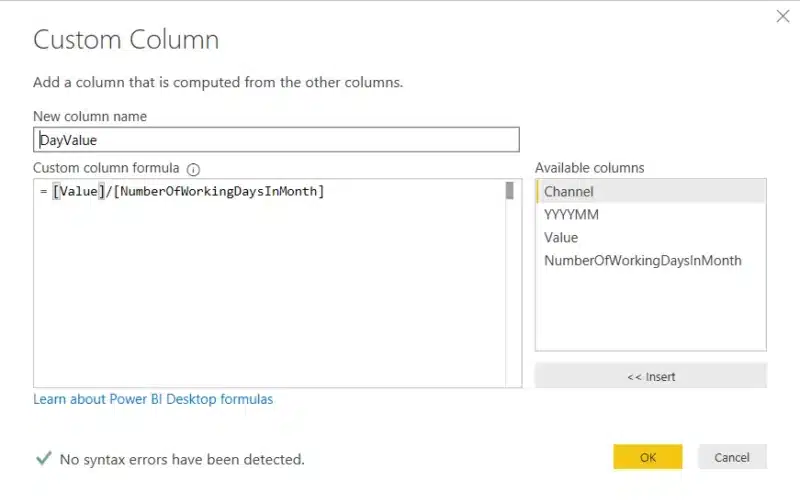
After calculating the DayValue, you can remove the Value column (or rename it to “MonthValue” or “WeekValue”), so the distinction is clear for the report designer.
As a final step in preparing our data, we merge the budget table with the calendar table (the one on day level). This allows generating one line for each calendar day.
We merge this on the YYYYMM or YYYYWW column.
When expanding the calendar table, only adding the Date or DateKey (YYYYMMDD) column is enough.
As you don’t need the aggregated Calendar by month table, you can disable load for this table.
Now your budget table is available on day level and easy to create the required DAX measures to generate the correct calculation.
Notice when writing DAX formulas you only sum the DayValues on working days.
| = CALCULATE(SUM(Budget[DayValue]); Calendar[IsWorkingDay] = 1) |
As a workaround you can create a calculated column so a DayValue is only available on working days.
| = IF(RELATED(Calendar[IsWorkingday]) = 1; Budget[DayValue]) |

Crafted by ![]()
Crafted by ![]()


