What is the buzz about ‘R’? What is R, how can I use it, where do I use it, how do I start? I had all the same questions about it, the first time I heard of it. That’s why to explain what the possibilities are in R and what you can use it for.
R is a programming language, just like you have C, Java, VB, etc. The main difference with other languages is that R is invented to do statistical computing. It’s actually nothing new at all, it has been used by statisticians and data miners for over twenty years for developing software and data analysis. Another interesting thing: R is maintained by the Free Software Foundation. In other words, R is free of charge and the source code is available for everyone. You can imagine a lot of plugins have been developed for R throughout these years, which makes the number of possibilities it has now humongous.
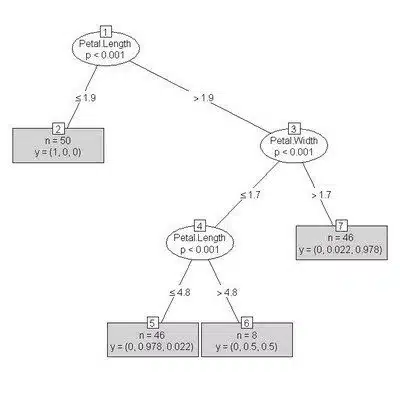
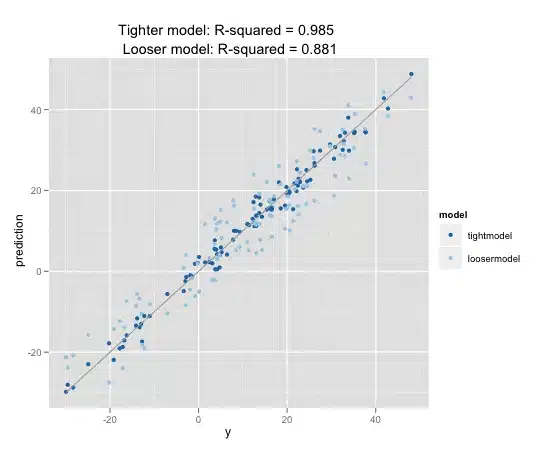
You can use R to do statistical calculation on any available data, such ass correlations, chance, decision trees, etc. Since numbers are not always easy to understand, there are a lot of plugins that can be loaded to chart this data. You can see some examples below.


Big Data or Small Data, it doesn’t matter. You can use R on almost all the data you have, keeping in mind that you know what you are doing of course. You need to understand some basic statistics to start with, so you can try out some things.
Why would you want to use R on your data? R allows you to find interesting facts in your data. When do people buy a second car? Is there a relation between the weather and selling ice-cream? When will there more traffic?
You can start using R with RStudio. It’s a free of charge tool that includes everything you need. However, since I am a Microsoft BI Consultant, I can’t stop myself from advertising Microsoft of course. Microsoft implemented R since in SQL Server & Power BI in SQL Server 2016, and that is just awesome! Because of that, the possibilities of SQL & Power BI increased by a huge number.
In my next blog I will start with explaining the basics of R. What data types do you have, how do you keep data together? I’ll keep on writing some posts about R and each time I’ll explain something more.
I hope you R ready for it!
| Cookie | Duration | Description |
|---|---|---|
| ARRAffinity | session | ARRAffinity cookie is set by Azure app service, and allows the service to choose the right instance established by a user to deliver subsequent requests made by that user. |
| ARRAffinitySameSite | session | This cookie is set by Windows Azure cloud, and is used for load balancing to make sure the visitor page requests are routed to the same server in any browsing session. |
| cookielawinfo-checkbox-advertisement | 1 year | Set by the GDPR Cookie Consent plugin, this cookie records the user consent for the cookies in the "Advertisement" category. |
| cookielawinfo-checkbox-analytics | 11 months | This cookie is set by GDPR Cookie Consent plugin. The cookie is used to store the user consent for the cookies in the category "Analytics". |
| cookielawinfo-checkbox-functional | 11 months | The cookie is set by GDPR cookie consent to record the user consent for the cookies in the category "Functional". |
| cookielawinfo-checkbox-necessary | 11 months | This cookie is set by GDPR Cookie Consent plugin. The cookies is used to store the user consent for the cookies in the category "Necessary". |
| cookielawinfo-checkbox-others | 11 months | This cookie is set by GDPR Cookie Consent plugin. The cookie is used to store the user consent for the cookies in the category "Other. |
| cookielawinfo-checkbox-performance | 11 months | This cookie is set by GDPR Cookie Consent plugin. The cookie is used to store the user consent for the cookies in the category "Performance". |
| CookieLawInfoConsent | 1 year | CookieYes sets this cookie to record the default button state of the corresponding category and the status of CCPA. It works only in coordination with the primary cookie. |
| elementor | never | The website's WordPress theme uses this cookie. It allows the website owner to implement or change the website's content in real-time. |
| viewed_cookie_policy | 11 months | The cookie is set by the GDPR Cookie Consent plugin and is used to store whether or not user has consented to the use of cookies. It does not store any personal data. |
| Cookie | Duration | Description |
|---|---|---|
| __cf_bm | 30 minutes | Cloudflare set the cookie to support Cloudflare Bot Management. |
| pll_language | 1 year | Polylang sets this cookie to remember the language the user selects when returning to the website and get the language information when unavailable in another way. |
| Cookie | Duration | Description |
|---|---|---|
| _ga | 1 year 1 month 4 days | Google Analytics sets this cookie to calculate visitor, session and campaign data and track site usage for the site's analytics report. The cookie stores information anonymously and assigns a randomly generated number to recognise unique visitors. |
| _ga_* | 1 year 1 month 4 days | Google Analytics sets this cookie to store and count page views. |
| _gat_gtag_UA_* | 1 minute | Google Analytics sets this cookie to store a unique user ID. |
| _gid | 1 day | Google Analytics sets this cookie to store information on how visitors use a website while also creating an analytics report of the website's performance. Some of the collected data includes the number of visitors, their source, and the pages they visit anonymously. |
| ai_session | 30 minutes | This is a unique anonymous session identifier cookie set by Microsoft Application Insights software to gather statistical usage and telemetry data for apps built on the Azure cloud platform. |
| CONSENT | 2 years | YouTube sets this cookie via embedded YouTube videos and registers anonymous statistical data. |
| vuid | 1 year 1 month 4 days | Vimeo installs this cookie to collect tracking information by setting a unique ID to embed videos on the website. |
| Cookie | Duration | Description |
|---|---|---|
| ai_user | 1 year | Microsoft Azure sets this cookie as a unique user identifier cookie, enabling counting of the number of users accessing the application over time. |
| VISITOR_INFO1_LIVE | 5 months 27 days | YouTube sets this cookie to measure bandwidth, determining whether the user gets the new or old player interface. |
| YSC | session | Youtube sets this cookie to track the views of embedded videos on Youtube pages. |
| yt-remote-connected-devices | never | YouTube sets this cookie to store the user's video preferences using embedded YouTube videos. |
| yt-remote-device-id | never | YouTube sets this cookie to store the user's video preferences using embedded YouTube videos. |
| yt.innertube::nextId | never | YouTube sets this cookie to register a unique ID to store data on what videos from YouTube the user has seen. |
| yt.innertube::requests | never | YouTube sets this cookie to register a unique ID to store data on what videos from YouTube the user has seen. |
| Cookie | Duration | Description |
|---|---|---|
| WFESessionId | session | No description available. |