
Steve is a 14-year old, clever, young man, one of the cool guys at school. He always keeps his mobile phone at hand. As a matter of fact, he has a black belt in texting. Steve texts as soon as he’s awake. No doubt he has to address dozens of friends and girlfriends informing him about all kinds of hip stuff at 7 AM every day. Mama Natalie forbids the phone during breakfast, but Steve continues texting in the bathroom, while getting his school bag ready, and, when mom is out of sight, on his bike heading for school.
Mama Natalie is a clever woman, but unlike her son Steve, she has a lot of responsabilities. When she is not at work – she’s a BI Consultant – she takes care of her family. She wants a good education for her son and help him to become a successful grown-up. Unfortunately, it seems that Steve’s texting behavior has been a bad influence on his grades at school. Until last year Steve did well at school, but all of that changed. Since Steve got a new phone, his results are constantly up, and down. Steve can’t explain these irregularities and mama Natalie has been trying to figure out why. She suspects Steve of favoring his phone over his books. Steve frequently studies with his phone within reach and it doesn’t take long before his mom urges him to put the phone outside the room. “But mom, I’m not using it“, Steve answers. Over the past months these small conversations have taken place on a daily basis, and the tone has become increasingly frustrating and wearisome for both.
She had to investigate this further. Mama Natalie knew just the right tool for doing this: Power Bi Desktop. First, she downloaded the latest phone bill detail records. Then, she copied and pasted all the text details from the pdf document, page by page, into a simple Notepad file. Next, mama Natalie loaded the Notepad file into a new Power BI Desktop file.

She formatted the columns of data as necessary. Columns one, two and three were renamed into SMSNumber, Date and Time. Column four was deleted. The dataset was named SMSDataSet. Now mama Natalie needed an extra column to analyze Steve’s texts by the hour. For this, she added a column Hour calculated as Hour(SMSDataSet[Time]). And of course, she didn’t want to count every single text message by herself, so she added a measure Count SMS defined as COUNTROWS(SMSDataSet). That was it! Mama Natalie could start her analysis. “Why did it took so long before people invented a tool like this? So damn easy to do your thing!” crossed her mind.
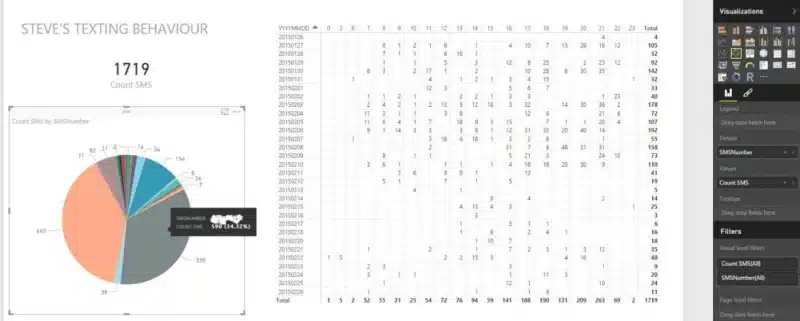
In the Power BI file she placed a simple Card visualization in the top left corner of a blank report page, and dragged the Count SMS measure onto it. “Holy smokes!” she cried out. She spilled her coffee over the mouse mat. It was worse than she had thought. This single month, Steve had sent more than 1,700 text messages. She was definitely on to something. “When did Steve text all these messages?” Mama Natalie configured a Matrix visualization on the report page with the Count SMS measure as a the grid’s value, the Date column on rows and the Hour column on columns. In a split second, the tool broke up the number of text messages into Date-Hour combinations. “Yes!”, she cheered. “That’s it. I must show this to Steve as soon as he gets home.”
Steve was in a good mood when he entered home from school that evening. He saw his mother sitting at the dining table in front of her laptop. “Hi mom, what’s up?” “Steve”, she said, “Look what I’ve been up to.” Steve noted a table of numbers on the laptop screen. Mama Natalie continued: “I’ve made an analysis of your texting behavior.” Steve didn’t understand what she really meant, but started feeling uneasy.
Referring to the grid on her screen, Mama Natalie explained. “This is a breakdown of your text messages by day and by hour, based on the latest phone bill detail records.” Steve was now listening attentively. His mom continued. “There is not a single day in the last month that you have not texted at school.” She didn’t await her son’s explanation and showed on the grid that Steve had been texting almost every school hour. Steve didn’t know what to say. “And look over here!” She pointed out the grid’s row totals. “Do you realize that each time you’ve had a bad test, the number of texts peaks the days before the test?” She tried not to raise her voice and put down a sheet with last month’s test results in front of him on the table. Mama Natalie enumerated each test, its date, its result and pointed out the number of messages for the corresponding proceeding period. Steve looked at the numbers and could not deny that he’d sent out hundreds of text messages the evenings before his tests. Steve remained silent, no use in denying this. Mama Natalie felt sorry for him and but she was relieved when she saw that Steve could make his right conclusion. Now, Steve thought she was finished with him.
Mama Natalie dragged a Pie Chart visual on the screen. “I wonder who you’re texting”, she said. Steve swallowed and before he could make any objections, the answer was already on the screen. Mama Natalie was also surprised. It appeared that only two phone numbers were responsible for 75% of Steve’s texting activity. She asked her son about these numbers. Steve had to confess these were the numbers of Eve and Jodie, two girls he’d met from another school. “Well, well”, his mom said. “That’s interesting. Do you realize now that you need to put your phone away during home work ? And that, if you think about it, this Eve and Jodie are responsible for your bad results?” She saw her son did not want to fully agree with her. “What do you feel about my little analysis? That is what I do for a living. I am a BI consultant. Business Intelligence. I find patterns and new information in existing information. Would you someday like to be into BI too? “, mama Natalie asked.

Crafted by ![]()
Crafted by ![]()


