


A while ago, Microsoft released a preview version of SQL Operations Studio. This new software package is supposed to simplify database management by putting frequently used queries into an organized dashboard. We’ve tested the preview version to get acquainted with it. In this blogpost, we’ll share what we think are the strong points and where the software has room to improve.
If you want to learn more about this topic, watch the free webinar replay about SQL Operations Studio of January 26th 2018 here.
SQL Operations Studio is a standalone application that lets you put frequently used queries into a dashboard for a quick overview of all your databases. The software is lightweight and uses very little resources, so it can effortlessly run next to more demanding tools like SQL Server Management Studio.
Using queries on your databases to get information such as available disk size, isn’t new. Before, you could manually run scripts on each database to extract statistics and then combine them. However, if you need to check this data on a daily basis, it becomes quite cumbersome and time-consuming. After a one-time setup per query, Operations Studio runs them for you and presents the results in clear graphs on a dashboard. Want to see the status of available disk size the next day too? Just refresh. With SQL Operations Studio you can now get insight into your databases with a push of the button.
Microsoft’s SQL Server 2017 took the first steps towards Linux, SQL Operations Studio fully embraces it by making querying on Linux platforms easier. This further simplifies management of your databases by combining cross-platform information in one dashboard. Including an open-source operating system is inline with the way Operations Studio is developed, as Microsoft has made the code openly available on GitHub.
SQL Operations Studio has a lot of potential, but it still has a long way to go which is to be expected from an unfinished product. For instance, there’s still a plethora of bugs – GitHub mentions a total of 260 at the time of writing this. The graph options are also rather limited for now. They’re sufficient for a test run, but not for complex cases. One option that we’d really like to see is time-based graphs. For example, if you automate a query to run every fifteen minutes, it would be nice if you got time reference points. That way you can figure out why a graph dipped or climbed.
We’ve tinkered with queries and creating a dashboard in SQL Operations Studio. Below you’ll find a couple of useful graphs to include with the needed code. Keep in mind, though that not every graph works for every query.
Query:
SELECT DISTINCT SUBSTRING(volume_mount_point, 1, 1) as drive_letter,

(total_bytes/1024/1024 - available_bytes/1024/1024) as usedsize_mb,

available_bytes/1024/1024 as available_size_mb

FROM sys.master_files AS f

CROSS APPLY

sys.dm_os_volume_stats(f.database_id, f.file_id)

CROSS APPLY

sys.dm_io_virtual_file_stats(f.database_id, f.file_id)
Graph:
Fig1. Okay for a pie chart
If we convert this pie chart to a bar chart however, we get a distorted bar chart, and a very imprecise view of the data.
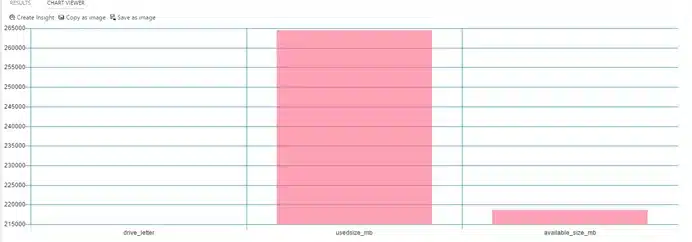
Fig2. Not okay for a bar chart.jpeg
And if you try to add even more values, like wait stats, things go terribly wrong:
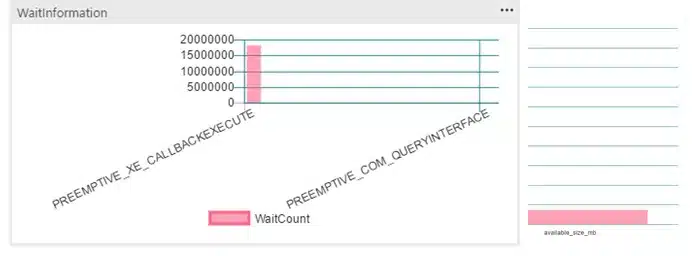
Fig3. Whoops
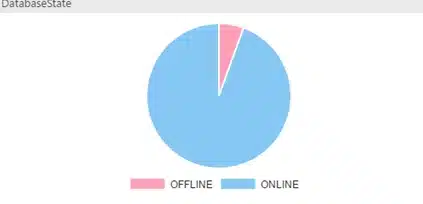
Fig5. Database state
Script:
select d.state_desc,

count(d.state_desc) as state

from   sys.databases d

where replica_id is NULL

group by d.state_desc
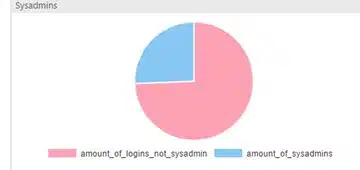
Fig6. Sysadmins <-> NonSysAdmins (and yes, my security policy sucks.)
Script:
SELECT (select count(*) from sys.syslogins where  sysadmin <> 1)   as amount_of_logins_not_sysadmin,
(select count(sysadmin)  from sys.syslogins where  sysadmin = 1) as amount_of_sysadmins
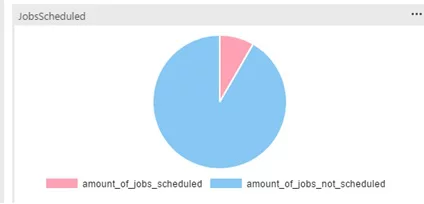
Fig 7. Looks like some jobs need to be scheduled.
Script:
SELECT (select count(s.name) FROM   msdb..sysschedules s inner join msdb..sysjobschedules a on s.schedule_id = a.schedule_id inner join msdb..sysjobs j on a.job_id = j.job_id ) as amount_of_jobs_scheduled,

(select (select count(job_id) from msdb..sysjobs)  -  (select count(s.name) FROM   msdb..sysschedules s inner join msdb..sysjobschedules a on s.schedule_id = a.schedule_id inner join msdb..sysjobs j on a.job_id = j.job_id )) as amount_of_jobs_not_scheduled
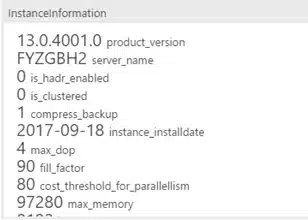
Fig 8. InstanceInformation
This one is a bit trickier. The script is bigger and the widget and chart are customized, since the default settings could not display the graph. We created the count chart using create insight and tweaked the JSON settings.
widget:
{

"name": "InstanceInformation",

"gridItemConfig": {

"sizex": 2,

"sizey": 1

},

"widget": {

"insights-widget": {

"type": {

"count": {

"dataDirection": "vertical",

"dataType": "number",

"legendPosition": "none",

"labelFirstColumn": false,

"columnsAsLabels": true

}

},

"queryFile": "SavedFileLocationhere"

}

}

}
We changed the “columnsAsLabels” attribute from false to true
Script:
declare @servername nvarchar(255)

DECLARE  @CompressBackup BIT, @InstanceInstalldate DATE, @MAXDOP INT, @Fillfactor INT, @CostThreshhold INT, @MaxMem INT, @Minmem INT, @Adhoc BIT,@Processors varchar(50), @ServerVersion varchar(300)

SET @ServerName = (SELECT TOP 1 NAME FROM   [sys].[servers])

SELECT @CompressBackup = CONVERT(BIT, value)

FROM   sys.configurations

WHERE  NAME = 'backup compression default';


SELECT @InstanceInstalldate = create_date

FROM    sys.server_principals

WHERE   name = N'NT AUTHORITY\SYSTEM';


SELECT @CostThreshhold = CONVERT(INT, value_in_use)

FROM   sys.configurations

WHERE  NAME = 'cost threshold for parallelism'


SELECT @MAXDOP = CONVERT(INT, value_in_use)

FROM   sys.configurations

WHERE  NAME =  'max degree of parallelism'


SELECT @Fillfactor = CONVERT(INT, value_in_use)

FROM   sys.configurations

WHERE  NAME = 'fill factor (%)';


SELECT @MaxMem = CONVERT(INT, value_in_use)

FROM   sys.configurations

WHERE  NAME = 'max server memory (MB)'


SELECT @Minmem = CONVERT(INT, value_in_use)

FROM   sys.configurations

WHERE  NAME = 'min server memory (MB)'


SELECT @Adhoc = CONVERT(INT, value_in_use)

FROM   sys.configurations

WHERE  NAME = 'optimize for ad hoc workloads'


select @Processors = cpu_count from sys.dm_os_sys_info

select    CONVERT(VARCHAR(50), SERVERPROPERTY('productversion')) as product_version ,

@@ServerName as server_name ,

CONVERT(BIT, Serverproperty('IsHadrEnabled')) as is_hadr_enabled,

CONVERT(BIT, Serverproperty('IsClustered')) as is_clustered,

@CompressBackup  as compress_backup,

@InstanceInstalldate as instance_installdate,

@MAXDOP as max_dop,

@Fillfactor as fill_factor,

@CostThreshhold as cost_threshold_for_parallellism ,

@MaxMem as max_memory,

@Minmem as min_memory,

@servername,

@Adhoc as optimize_for_ad_hoc_queries,

@Processors as amount_of_processors,

CONVERT(VARCHAR(100), SERVERPROPERTY('Edition')) as edition


