


A couple of months ago my colleague Franky Leeuwerck wrote an excellent blog post on how to create a complete date table (calendar dimension) in 6 steps in PowerPivot for Excel.
With the introduction of “calculated columns” in Power BI Desktop, things have become even easier. In this blog post I will show you how to create a complete date table is just 2 simple steps.
Go to the modelling ribbon, where you will now find a new button called “New Table”.
If you click on this button you can write a DAX expression, similar to how you would have done with the calculated columns and measures before.
The following DAX expression will generate a single column table containing 1 row for every single date between 1 January 2000 and 31 December 2025.
Date =CALENDAR (DATE(2000;1;1); DATE(2025;12;31))
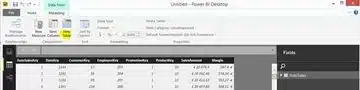
That’s just the start. We will enhance this formula with ADDCOLUMNS()) to add extra calculated columns to the table, such as month, year, day of the week, etc.
Date =
ADDCOLUMNS (
CALENDAR (DATE(2000;1;1); DATE(2025;12;31));
"DateAsInteger"; FORMAT ( [Date]; "YYYYMMDD" );
"Year"; YEAR ( [Date] )
)
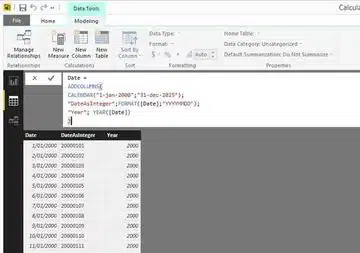
The final formula for the calculated table should look something like this:
Date =

ADDCOLUMNS (

CALENDAR (DATE(2000;1;1); DATE(2025;12;31));

"DateAsInteger"; FORMAT ( [Date]; "YYYYMMDD" );

"Year"; YEAR ( [Date] );

"Monthnumber"; FORMAT ( [Date]; "MM" );

"YearMonthnumber"; FORMAT ( [Date]; "YYYY/MM" );

"YearMonthShort"; FORMAT ( [Date]; "YYYY/mmm" );

"MonthNameShort"; FORMAT ( [Date]; "mmm" );

"MonthNameLong"; FORMAT ( [Date]; "mmmm" );

"DayOfWeekNumber"; WEEKDAY ( [Date] );

"DayOfWeek"; FORMAT ( [Date]; "dddd" );

"DayOfWeekShort"; FORMAT ( [Date]; "ddd" );

"Quarter"; "Q" & FORMAT ( [Date]; "Q" );

"YearQuarter"; FORMAT ( [Date]; "YYYY" ) & "/Q" & FORMAT ( [Date]; "Q" )

)
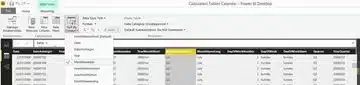
Power BI sorts attribute values alphabetically by default, so for example the names of the months would be sorted like this: April, August, December and so on. But you can easily fix this. Click on the “Sort By Column” button and choose the appropriate column to sort by. For MonthNameShort this would be MonthNumber.
And that’s it! You can now create a complete date table in Power BI, using the new calculated table feature in Power BI Desktop, in just a few minutes.
Do you want to see a step-by-step video? Just watch our tutorial below.
If you want to download the DateTablePowerBISteps.pbix, just fill out your details below.
[contact-form-7 id=”3956″ title=”Download Gated File”]


