


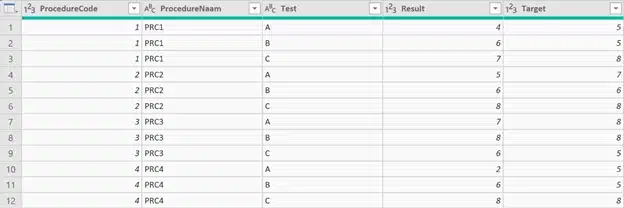
Recently I had a customer providing data for a PowerBI report in the below format:

We have procedures containing several tests and for each test a result and target value.

As you might notice, the format of the data provided is not ideal for reporting purposes. Creating visuals based on data in this format is not easy (try it!). You would have to write a measure for each test and if an additional test is added to a procedure the setup, as is, is not workable.
The result we aim to obtain is this:
We want a column for ProcedureCode and ProcedureName (= no change in regard to the original setup). Next to these we want 1 column for test, 1 for the result value and 1 for the target value.
You can achieve this using a combination of pivoting and unpivoting columns and this blog post will show you how to do this.
Let’s go ahead.
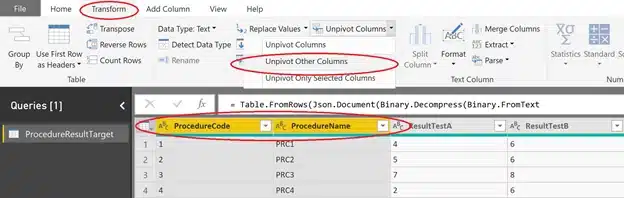
Select the columns that should remain unchanged (= ProcedureCode and ProcedureName).
In the Transform tab choose unpivot columns and unpivot other columns.
We use the ‘unpivot other columns’ approach to be future proof. If an additional test is added we have more columns that need to be unpivoted and by using the ‘other columns’ approach we don’t hardcode the columns to unpivot, we hardcode the columns that remain.
This results in a new format that better suits our needs. We now have an attribute-value pair for each of the original columns we unpivoted.
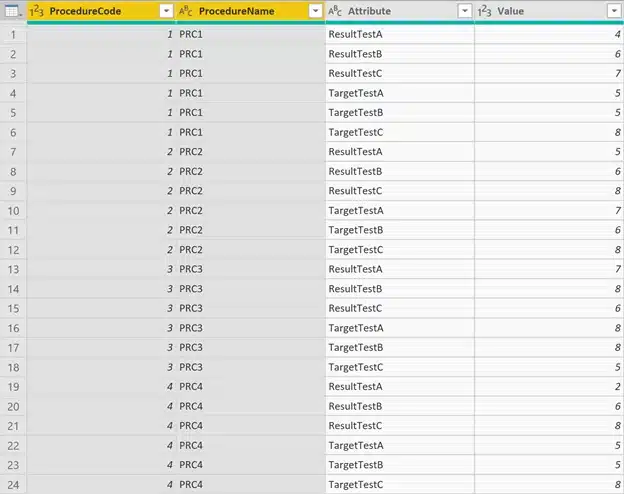
As you can see in the image above, we only have 1 column with values and in fact we want a column for results and a column for targets so we need to do some more transformations.
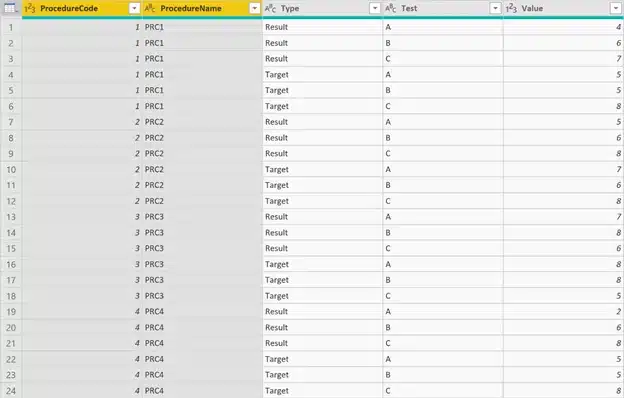
To achieve this we need to transform the value in the Attribute column to obtain 2 columns:
NOTE: the name of the test should be identical for both the Result and the Target.
Depending on the column names you have in your dataset you need to pick the correct transformation to achieve this. This can be a split column by delimiter, conditional column based on the occurrence of a word, replace value, …
In my case the length of the prefix part (‘Result’ and ‘Target’) is identical so a split by number of characters was enough to achieve the 2 columns..
I also replaced the prefix ‘Test’ to have only A, B, C,… as a remainder to have a cleaner dataset.
As a final step the only thing we still need to do is to pivot the Type and Value column to have the result we need.
Select the columns Type and Value. In the Transform tab choose pivot column.
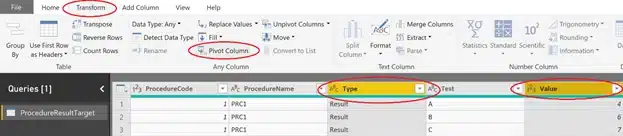
By doing this we get the result we aimed for.

Our dataset is now ready to create some nice visuals.
For those interested in the M-code used in this demo:
let
Source =
Table.FromRows(Json.Document(Binary.Decompress(Binary.FromText(“i45WMlTSUQoIcgZRJkBsBsTmQGwKxRZKsTrRSkYQRUZQQTOwBEShGVyRMUSRMVTCAkmhBVgjSJEJRBGIMkJSgGRdLAA=”, BinaryEncoding.Base64), Compression.Deflate)), let _t = ((type text) meta [Serialized.Text = true]) in type table [ProcedureCode = _t, ProcedureName = _t, ResultTestA = _t, ResultTestB = _t, ResultTestC = _t, TargetTestA = _t, TargetTestB = _t, TargetTestC = _t]),
#”Changed Type” = Table.TransformColumnTypes(Source,{{“ProcedureCode”, Int64.Type}, {“ProcedureName”, type text}, {“ResultTestA”, Int64.Type}, {“ResultTestB”, Int64.Type}, {“ResultTestC”, Int64.Type}, {“TargetTestA”, Int64.Type}, {“TargetTestB”, Int64.Type}, {“TargetTestC”, Int64.Type}}),
#”Unpivoted Columns” = Table.UnpivotOtherColumns(#”Changed Type”, {“ProcedureCode”, “ProcedureName”}, “Attribute”, “Value”),
#”Split Column by Position” = Table.SplitColumn(#”Unpivoted Columns”, “Attribute”, Splitter.SplitTextByPositions({0, 6}, false), {“Type”, “Test”}),
#”Changed Type1″ = Table.TransformColumnTypes(#”Split Column by Position”,{{“Type”, type text}, {“Test”, type text}}),
#”Replaced Value” = Table.ReplaceValue(#”Changed Type1″,”Test”,””,Replacer.ReplaceText,{“Test”}),
#”Pivoted Column” = Table.Pivot(#”Replaced Value”, List.Distinct(#”Replaced Value”[Type]), “Type”, “Value”, List.Sum)
in
#”Pivoted Column”

Crafted by ![]()
Crafted by ![]()


