


What is the buzz about ‘R’? What is R, how can I use it, where do I use it, how do I start? I had all the same questions about it, the first time I heard of it. That’s why to explain what the possibilities are in R and what you can use it for.
R is a programming language, just like you have C, Java, VB, etc. The main difference with other languages is that R is invented to do statistical computing. It’s actually nothing new at all, it has been used by statisticians and data miners for over twenty years for developing software and data analysis. Another interesting thing: R is maintained by the Free Software Foundation. In other words, R is free of charge and the source code is available for everyone. You can imagine a lot of plugins have been developed for R throughout these years, which makes the number of possibilities it has now humongous.
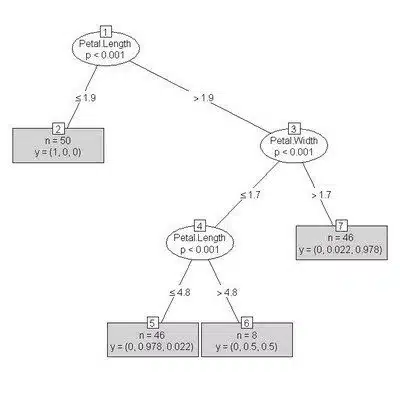
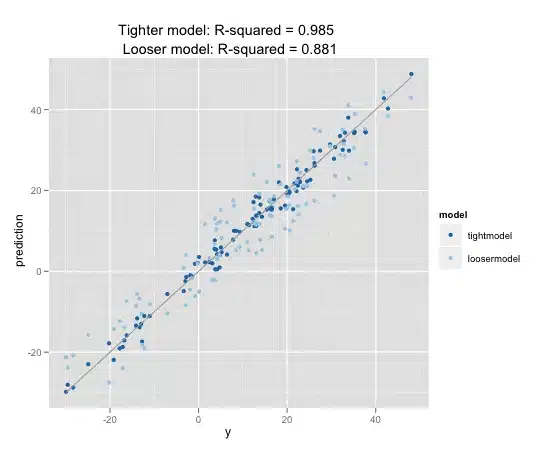
You can use R to do statistical calculation on any available data, such ass correlations, chance, decision trees, etc. Since numbers are not always easy to understand, there are a lot of plugins that can be loaded to chart this data. You can see some examples below.
Big Data or Small Data, it doesn’t matter. You can use R on almost all the data you have, keeping in mind that you know what you are doing of course. You need to understand some basic statistics to start with, so you can try out some things.
Why would you want to use R on your data? R allows you to find interesting facts in your data. When do people buy a second car? Is there a relation between the weather and selling ice-cream? When will there more traffic?
You can start using R with RStudio. It’s a free of charge tool that includes everything you need. However, since I am a Microsoft BI Consultant, I can’t stop myself from advertising Microsoft of course. Microsoft implemented R since in SQL Server & Power BI in SQL Server 2016, and that is just awesome! Because of that, the possibilities of SQL & Power BI increased by a huge number.
In my next blog I will start with explaining the basics of R. What data types do you have, how do you keep data together? I’ll keep on writing some posts about R and each time I’ll explain something more.
I hope you R ready for it!

Crafted by ![]()
Crafted by ![]()


