The aim is to read in various types of data file (with medical diagnoses, medicines, number of bed days, admission and discharge details), as well as plan staffing requirements. This enables the hospital to check which teams will need extra support in busy periods, calculate the cost-price for patient interventions, group activities together by health insurance codes, work out the total cost of treatment, assess the ratio between bed days and personnel planning, etc.
Together with an analyst and the hospital’s IT team, we set up a proof-of-concept reporting system for MS Power BI. The hospital already generates a whole series of reports, but they still require hours of manual work and are difficult to share with all hospital employees. These lost hours are becoming a thing of the past, however, thanks to MS Power BI.
A customised report
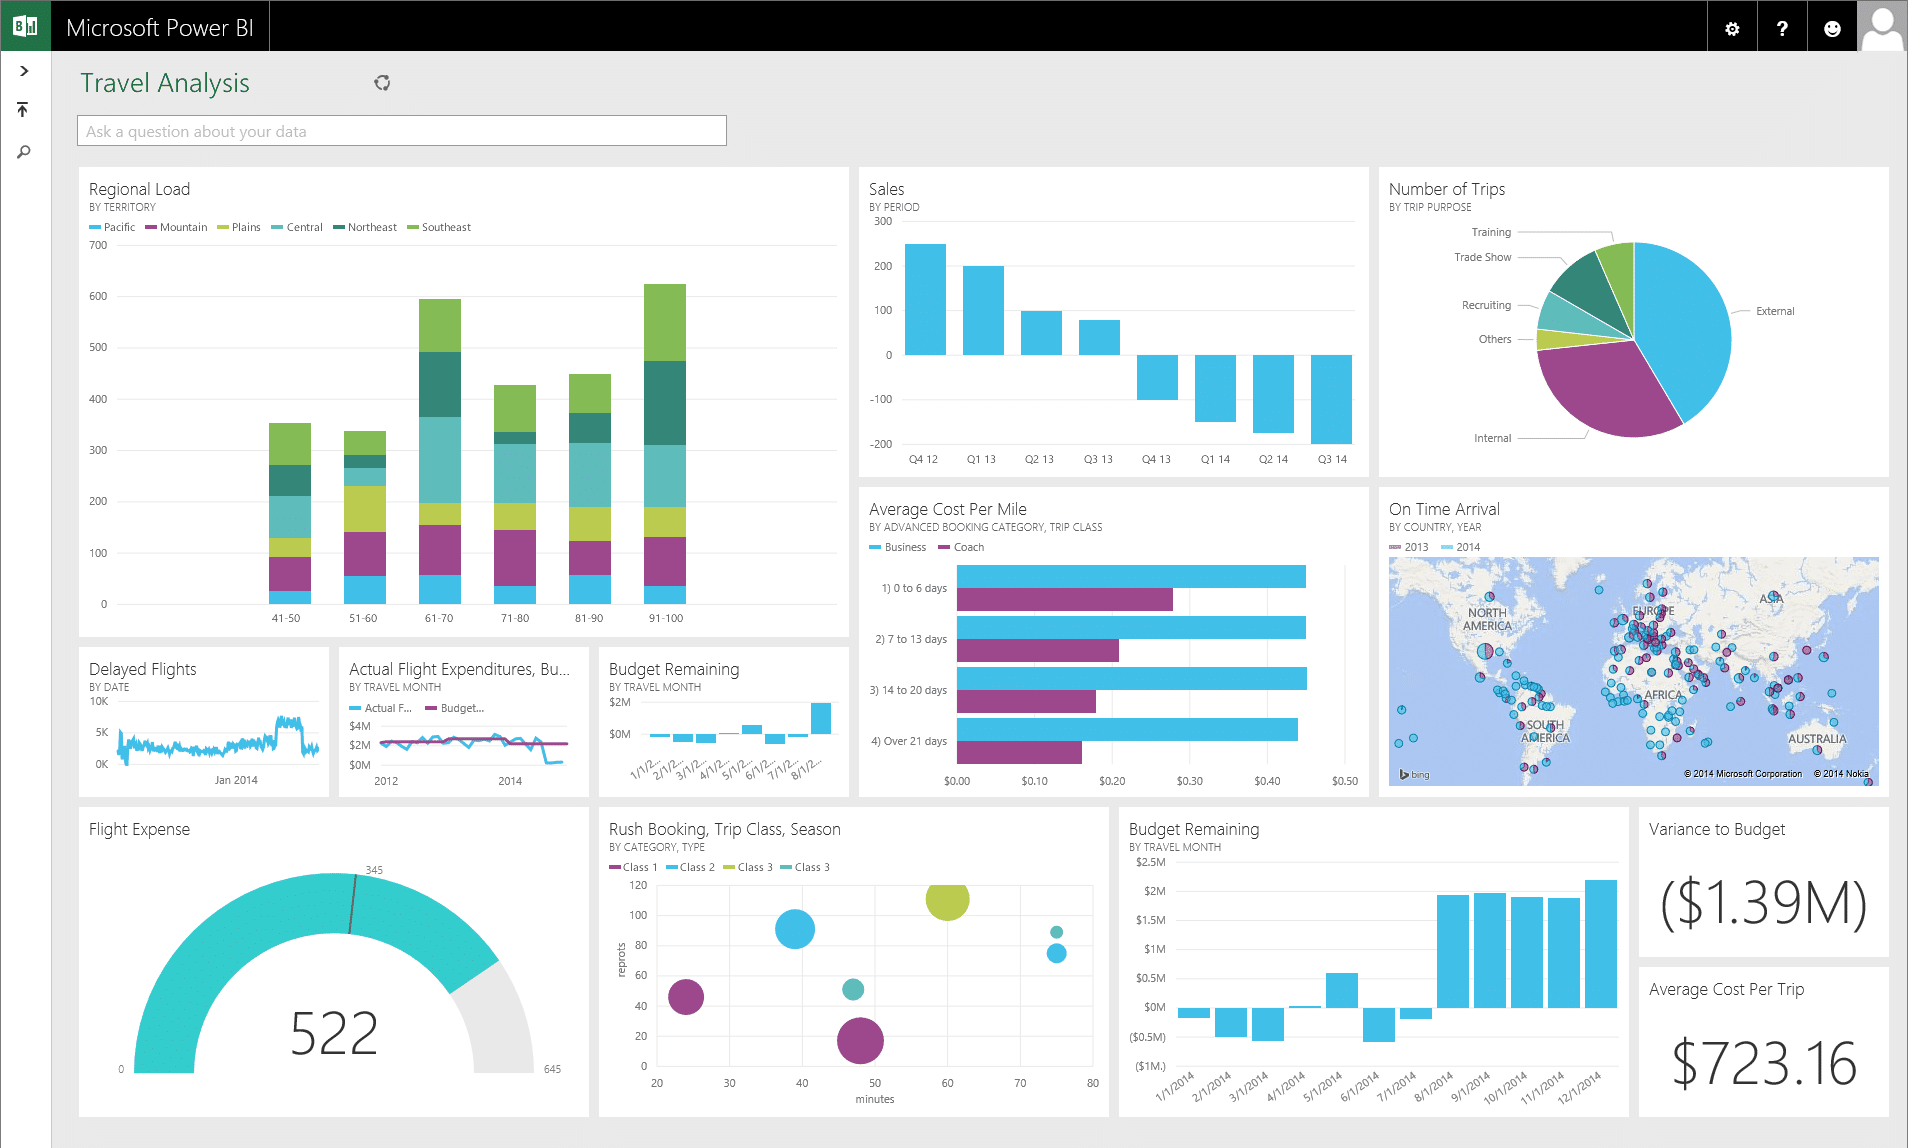
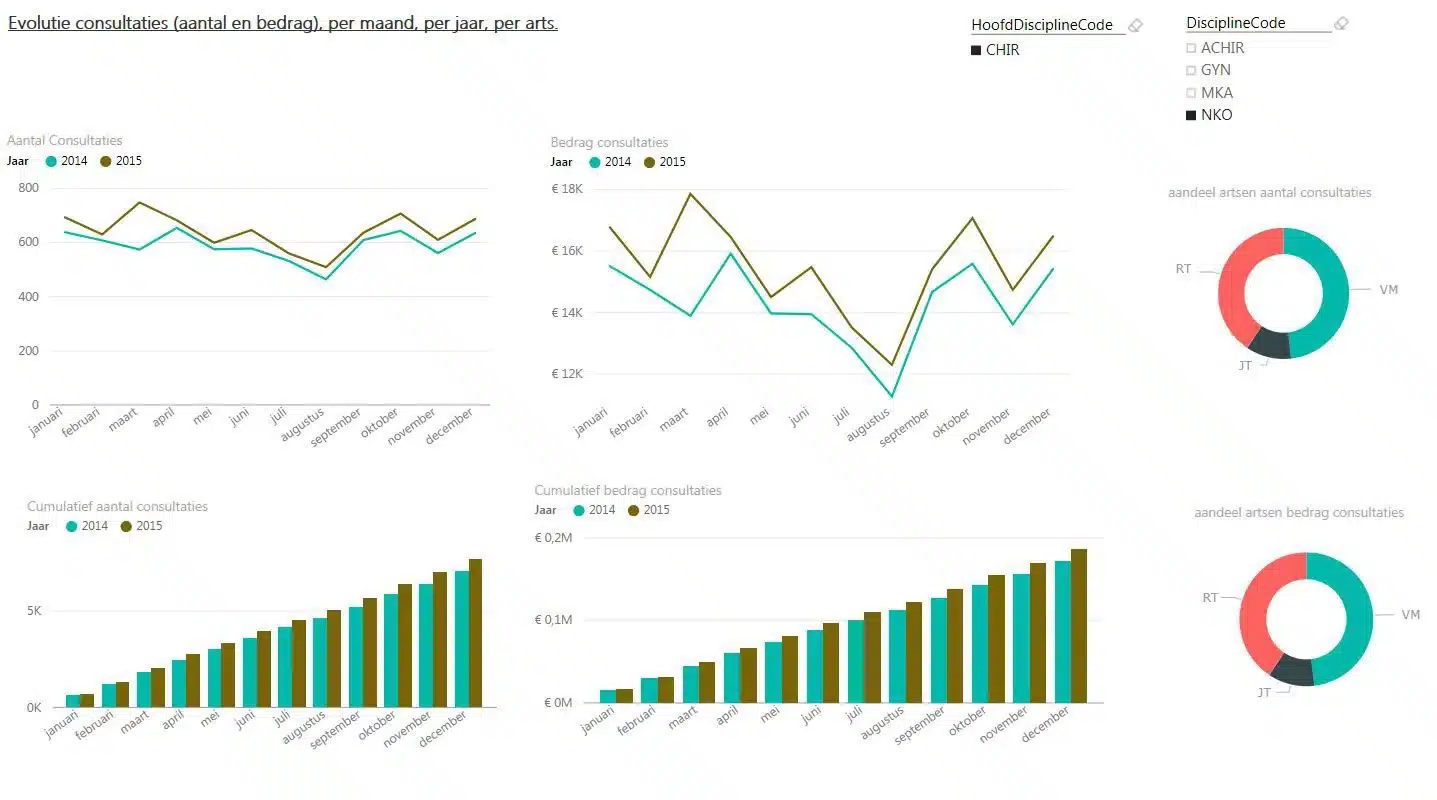
Users can now perform their own analyses and create interactive reports with the new reporting system, using pivot tables, standard reports and dashboards in Microsoft Excel. The PowerBI.com online dashboard is also used to centralise core figures for management. This means the IT team saves time making calculations and creating reports, so it can focus on continuously improving core applications and providing user support, and managers can see the most important details at a glance.
Managers in the hospital will soon be able to consult reports and look up all sorts of important information: patient histories, how long they’ve been admitted, which interventions are performed the most, how many consultations there have been, performance compared with previous years, checking to see if there’s an increasing need for certain disciplines, and so on. We always come up with new possibilities when we talk about reporting with people at the hospital.
Technical assistance
Our technical assistance at Sint-Rembert consisted of setting up an SQL Server database on a new virtual machine, modelling a data warehouse, converting the original DB2 data to CSV data sets with calculated tables, and structuring the basic data in a so-called tabular model. This means we’ve got everything ready to start to building the reports in Microsoft Excel using the Power Pivot add-in, and have set up interactive dashboards with MS Power BI. We’re now training the analyst at the hospital to become an expert in smarter reporting.

© 2023 Kohera
Crafted by ![]()
© 2022 Kohera
Crafted by ![]()
| Cookie | Duration | Description |
|---|---|---|
| ARRAffinity | session | ARRAffinity cookie is set by Azure app service, and allows the service to choose the right instance established by a user to deliver subsequent requests made by that user. |
| ARRAffinitySameSite | session | This cookie is set by Windows Azure cloud, and is used for load balancing to make sure the visitor page requests are routed to the same server in any browsing session. |
| cookielawinfo-checkbox-advertisement | 1 year | Set by the GDPR Cookie Consent plugin, this cookie records the user consent for the cookies in the "Advertisement" category. |
| cookielawinfo-checkbox-analytics | 11 months | This cookie is set by GDPR Cookie Consent plugin. The cookie is used to store the user consent for the cookies in the category "Analytics". |
| cookielawinfo-checkbox-functional | 11 months | The cookie is set by GDPR cookie consent to record the user consent for the cookies in the category "Functional". |
| cookielawinfo-checkbox-necessary | 11 months | This cookie is set by GDPR Cookie Consent plugin. The cookies is used to store the user consent for the cookies in the category "Necessary". |
| cookielawinfo-checkbox-others | 11 months | This cookie is set by GDPR Cookie Consent plugin. The cookie is used to store the user consent for the cookies in the category "Other. |
| cookielawinfo-checkbox-performance | 11 months | This cookie is set by GDPR Cookie Consent plugin. The cookie is used to store the user consent for the cookies in the category "Performance". |
| CookieLawInfoConsent | 1 year | CookieYes sets this cookie to record the default button state of the corresponding category and the status of CCPA. It works only in coordination with the primary cookie. |
| elementor | never | The website's WordPress theme uses this cookie. It allows the website owner to implement or change the website's content in real-time. |
| viewed_cookie_policy | 11 months | The cookie is set by the GDPR Cookie Consent plugin and is used to store whether or not user has consented to the use of cookies. It does not store any personal data. |
| Cookie | Duration | Description |
|---|---|---|
| __cf_bm | 30 minutes | Cloudflare set the cookie to support Cloudflare Bot Management. |
| pll_language | 1 year | Polylang sets this cookie to remember the language the user selects when returning to the website and get the language information when unavailable in another way. |
| Cookie | Duration | Description |
|---|---|---|
| _ga | 1 year 1 month 4 days | Google Analytics sets this cookie to calculate visitor, session and campaign data and track site usage for the site's analytics report. The cookie stores information anonymously and assigns a randomly generated number to recognise unique visitors. |
| _ga_* | 1 year 1 month 4 days | Google Analytics sets this cookie to store and count page views. |
| _gat_gtag_UA_* | 1 minute | Google Analytics sets this cookie to store a unique user ID. |
| _gid | 1 day | Google Analytics sets this cookie to store information on how visitors use a website while also creating an analytics report of the website's performance. Some of the collected data includes the number of visitors, their source, and the pages they visit anonymously. |
| ai_session | 30 minutes | This is a unique anonymous session identifier cookie set by Microsoft Application Insights software to gather statistical usage and telemetry data for apps built on the Azure cloud platform. |
| CONSENT | 2 years | YouTube sets this cookie via embedded YouTube videos and registers anonymous statistical data. |
| vuid | 1 year 1 month 4 days | Vimeo installs this cookie to collect tracking information by setting a unique ID to embed videos on the website. |
| Cookie | Duration | Description |
|---|---|---|
| ai_user | 1 year | Microsoft Azure sets this cookie as a unique user identifier cookie, enabling counting of the number of users accessing the application over time. |
| VISITOR_INFO1_LIVE | 5 months 27 days | YouTube sets this cookie to measure bandwidth, determining whether the user gets the new or old player interface. |
| YSC | session | Youtube sets this cookie to track the views of embedded videos on Youtube pages. |
| yt-remote-connected-devices | never | YouTube sets this cookie to store the user's video preferences using embedded YouTube videos. |
| yt-remote-device-id | never | YouTube sets this cookie to store the user's video preferences using embedded YouTube videos. |
| yt.innertube::nextId | never | YouTube sets this cookie to register a unique ID to store data on what videos from YouTube the user has seen. |
| yt.innertube::requests | never | YouTube sets this cookie to register a unique ID to store data on what videos from YouTube the user has seen. |
| Cookie | Duration | Description |
|---|---|---|
| WFESessionId | session | No description available. |