


If you want to see the topic of this blog in action, then watch our free webcast on the latest features in Power BI where we discuss this new capability of Microsoft’s BI tool by clicking here.
Of course, it was possible to extract the data, but it took quite some time to figure out how to get this done properly with the tool. Luckily, Power BI has new option that might make our lives easier: import text/CSV by example. We’ll show you how to use it in this blog.
We have a demo file called Bikes.txt with the following content:
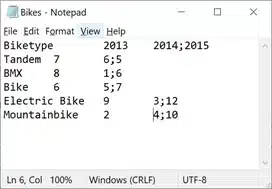
The content is not that complex. We can see at first glance what and how we want the data to be extracted from the file.
| Biketype | 2013 | 2014 | 2015 |
| Tandem | 7 | 6 | 5 |
| BMX | 8 | 1 | 6 |
| Bike | 6 | 5 | 7 |
| Electric Bike | 9 | 3 | 12 |
| Mountainbike | 2 | 4 | 10 |
From a technical point of view, however, it is a bit more complex since multiple different separators are used. First a tab is used and later on a semicolon. In the past, we had to import the file using one of the two separators and then start splitting the columns again using the other separator. Or another method like that.
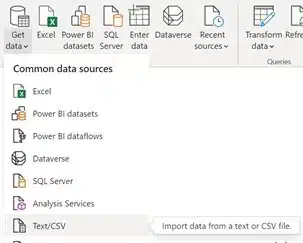
With ‘import text/CSV by example’, there’s an easier way to get the right data sorted into the right column within our Power BI report. We start the same as always to get data from a CSV or text file.
After selecting the file, we get the usual window showing how Power BI interprets the file layout. Here we immediately see that we have an issue caused by the different separators. Changing the delimiter to ‘tab’ might improve the situation, but that still leaves some columns not properly split.
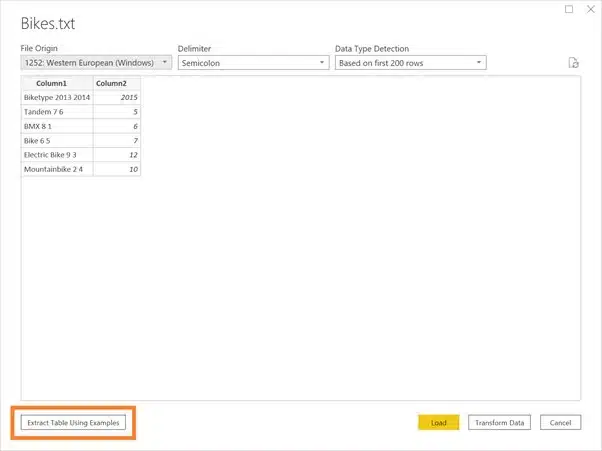
Now let’s have a look at what happens when we click on the new button in the bottom left corner ‘Extract Table Using Examples’.
A new window pops up where we have the option to manually input the data the way we want it visualized and separated. After filling in a couple of values, Power BI autodetects how it should handle your imported data and fills in the other values. In this example the headers and first line where sufficient.
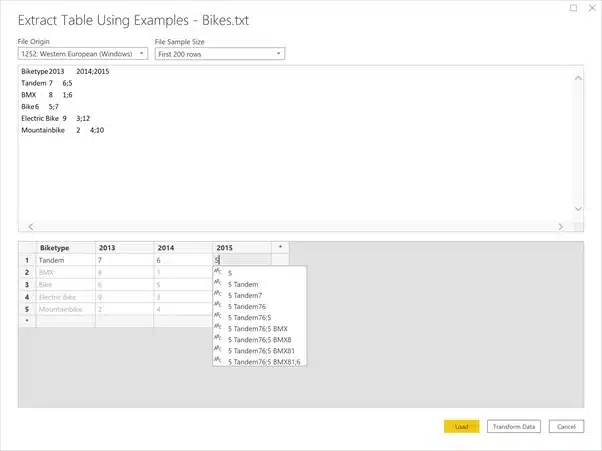
If you need more information about what Power BI did behind the scenes, you can click on ‘Transform Data’. Then, in the Power Query Editor, we see a breakdown of the multiple steps Power BI took to reach the desired result. If all looks good, we can then let Power BI load the data using these steps. Another step closer to making our lifes easier!


Crafted by ![]()
Crafted by ![]()


