There are two main configurations concerning memory: the minimum and maximum memory. At start up, SQL Server will not commit immediately to the configured minimum. Instead it will ask the OS gradually for more memory when more is needed. If SQL Server needs to give back some memory to the OS, then the value dropped won’t drop below the configured minimum.
The configured maximum amount of memory includes all memory types described above. Depending on your edition of SQL Server there are limitations in place, but there is also good news! All limitations concerning memory are for specific memory types.
For a standard edition installation, you have the following limitations:
- 128 Gb for the buffer cache
- 32 Gb for the columnstore cache
- 32 Gb for the OLTP cache
All other types of memory – plan cache for example – are not included in those numbers.
This means that, even if you have a Standard Edition installation, it is worthwhile to have your maximum amount of memory higher than 128Gb (depending on the type of features used).
Where are my metrics?
The dmv sys.dm_os_memory_clerks gives you the usage for all memory types at that time. In the SQL Server Management Studio, the same information is also available in the report “Memory Consumption”.
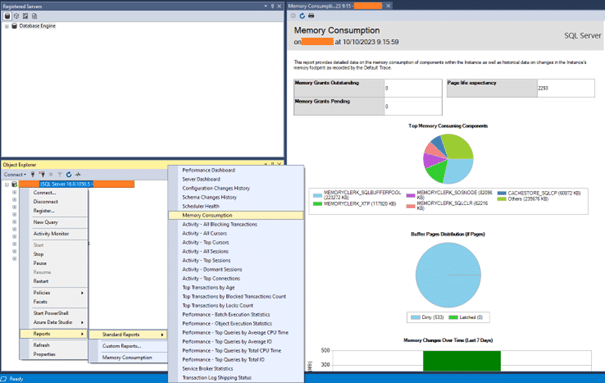
This report gives you a visual overview of the most-used types, the current page-life expectancy and memory grants, the changes in allocated memory and a detailed table listing all types and their usage.
How do I monitor all this?
The dmv and the report in SSMS only gives you a static view of your memory at a certain point of time. Collect these metrics regularly to be able to see the evolution and to set a baseline. This is, of course, only a part of the story.
To have a more complete view of your situation you can use performance metrics, which are collected by a lot of monitoring tools present on the market. The current values of the metrics are also available with the dmv sys.dm_os_performance_counters, and you can use them to configure a SQL Server Alert.
| Performance metric |
Description |
| Monitoring the buffer cache: is your configuration and set-up optimal for the amount of data that needs to be processed? |
| SQLServer:Memory Manager – Total Server Memory (KB) |
Total memory allocated to SQL Server by the OS. Big jumps in this metric indicates that SQL Server had to release memory to another application but needed it again (soon) afterwards. Each time this happens, the buffer pool is flushed and you can experience performance problems. |
| SQLServer:Memory Manager – Database Cache Memory (KB) |
Total usage of memory for the buffer cache compared to the total server memory to see if you would need to configure a higher amount of maximum memory. |
| SQLServer:Memory Manager – Stolen Server Memory (KB) |
Total usage of memory except the buffer cache. |
| SQLServer:Buffer Manager: Buffer Cache Hit Ratio |
Percentage describing if ‘read’ requests were able to pull pages out of memory, or if it needed to retrieve them from disk first. Aim for a value of 95%. |
| SQLServer:Buffer manager – Page life expectancy |
Number of seconds the oldest page lived in the buffer cache. There isn’t a ‘correct’ number for this, you should baseline this per server to see which values are normal. What could be helpful is to monitor the number of sudden page life expectancy drops you have per day/hour. |
| SQLServer:Buffer Manager – Page reads/sec |
Number of physical pages read per second. This value gets high when sql server needs to retrieve data from disk because it could not be found in the cache. |
| SQLServer:Access Methods:Full Scans/sec |
Number of times an object (index/heap) was scanned. This value needs to be baselined and used together with the disk read activity. For example, if you have a lowish number of scans but a high number of pages read, then you might have performance problems with specific queries that don’t have the adequate index to use. On the other side, a high number of scans on a very small object is not necessarily a problem. |
| Monitoring the plan cache: are you hitting certain limitations volume or n° of plans in the plan cache, or is plan cache released constantly for usage on other memory types? |
| SQLServer:Plan Cache – Cache Pages |
Total usage of memory for the plan cache. |
| SQLServer:Plan Cache – Cache Object Counts |
Total number of items per plan cache type. A high number of objects in the cache might indicate a problem with ad-hoc queries or non-parameterized queries. This can become an issue when the number of compiles gets too high (high use of cpu). |
| SQLServer:SQLStatistics – SQL Compilations/sec |
This value needs to be baselined. A query is normally only compiled the first time that it is executed. After this, consecutive executions don’t need to perform a compilation if the query plan remains in the cache. A lot of compiles might indicate a lot of ad-hoc queries being executed, or the plan cache being released because memory was needed for other purposes. |
| SQLServer:SQL Statistics – Re-Compilations/sec |
This happens when the query engine finds a query plan in the cache but finds it no longer valid. Part of or the whole plan is then recompiled. This can happen when, for example, a table structure used by a stored procedure has changed (including rebuilding of index/update of statistics). |
| Can be helpful for both plan cache and buffer cache monitoring |
| SQLServer:Memory Manager – Free Memory |
The amount of dynamic memory SQL Server has allocated, but that is not used. It is therefore free to be used by any pool (depending on the limitation of the pool). If this number is very low, this means that there is no margin, and if a pool needs more space, another pool will have to release some of its content. |
| Memory grants: excessive waits or wait volume might indicate performance issues on queries with sorting, hashing, … |
| SQLServer:Memory Manager – Memory Grants Pending |
Number of queries that are waiting for a memory grant. You want this number as low as possible |
| SQLServer:Memory Manager – Granted Workspace Memory(KB) |
Total amount of dynamic memory the server is using during memory grants (sorting, hashing, index creation) |
