


Splitting datasets and reports into separate PBIX files is a very common way of managing Power BI reports. This approach keeps data and calculations in a more central repository which acts as a “Single Source of Truth”. But dividing sets and reports can result in a headache or two. Let our blog be your Power BI painkiller.
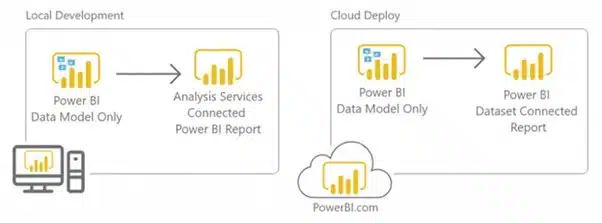
Once you have a Single Source of Truth, you can use it in as many reports as you’d like. The reporting layer only visualizes the data and connects to the repository through a live connection. That makes it very easy to switch data sources. The report file can easily be moved from using test data to using a production data source for example.
Those are convincing arguments for splitting reports, but it is not very practical for the developer. Searing migraines have been known to occur when you need to change measures in your extremely large dataset. The problem is that the report is connected to the dataset in the Power BI Service. When you want to see the updated measures in the report, you’ll have to republish the entire dataset to the service every time. Far from ideal for developing reports smoothly.
Luckily, there’s a solution for every problem. Yes indeed, this challenge can also easily be tackled. More specifically, by using the Hot Swap Report Connections tool from Steve Campbell. This tool enables you to quickly switch between a local live connection and a live connection to the Power BI service in your report file. In other words, it allows you to set up a local development environment that can be easily deployed to the cloud when you’re ready.
Time to get our hands dirty. I’ll start from a Power BI sample report.
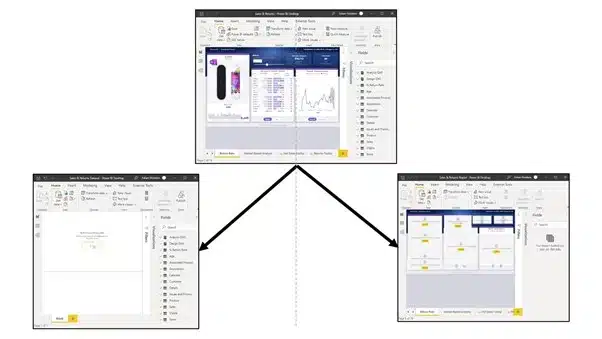
The easiest way to split the Power BI file is by duplicating the PBIX file. I’ll add the suffixes report and dataset to the filenames. In the dataset file, I’ll remove all visualizations and report pages. In the report file I’ll do the opposite. I’ll keep all visualizations, but remove the entire data model such as tables and measures. The result is shown below. We end up with two broken files:
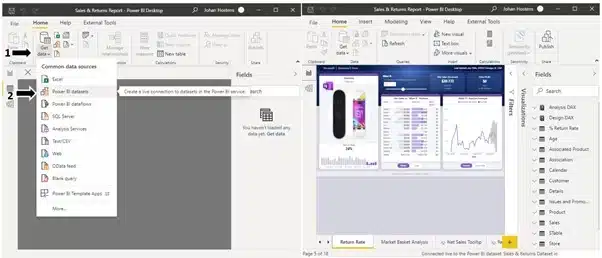
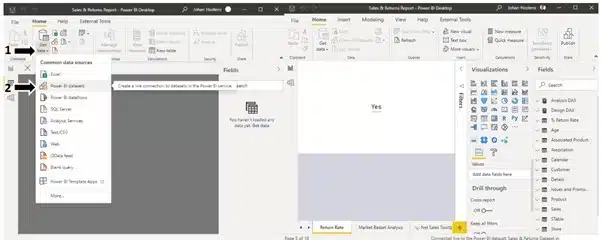
Time to fix our report. This is done by publishing the dataset to the service. Once this is done, you can add a live connection data source in the local report file. Tada, all visuals are working again. It’s magic! As you can see on the image below the data view disappeared and Connected live to the Power BI dataset: Sales & Returns Dataset in …. appeared in the status bar. Our split was successful.
Suppose we want to create a new measure for one of the visuals in the report. This would mean that we have to:
For one small change, that’s no problem. However, if you want to make some changes iteratively, you’ll have to repeat this process over and over again. In other words, you’ll often have to wait. One solution would be copying some of the visuals to the dataset temporary and test them this way. But again, this is not a proper solution. Aargh, the headache begins. But wait there is a better way!
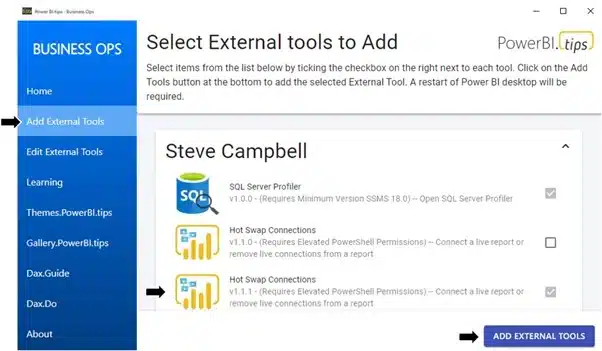
It’s time to bring in the Hot Swap Report tool. You can install this with the Business Ops tool. This is an all-in-one external tool installer for Power BI which contains many other blog-post-worthy components.
To install Hot Swap Connections go to Add External tools in Business Ops. Next, click on the checkbox next to Hot Swap Connections in the section of Steve Campbell. Then, click on the Add External Tools button.
Once Hot Swap Report tool is installed, we’ll take the following steps:
So let’s go through these steps in a bit more detail.
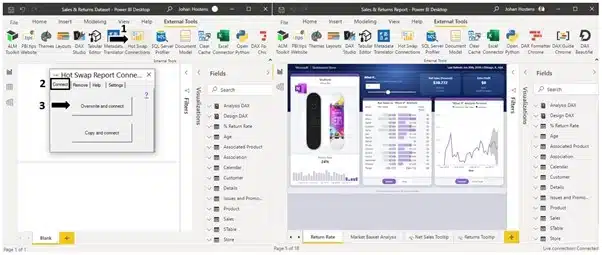
First, open the dataset file and navigate to external tools in the top ribbon. Click on the Hot Swap Connections button (1). In the window that opens, go to the Connect tab (2) and press Overwrite and connect (3). A file selection dialog opens. Select the report file and continue.
If you look closely at the status bar once your file has opened, you’ll see that the text in it has changed. Now it reads Live Connected instead of Connected live to the…. . The report file is now linked to the local dataset.
Remark: you can also choose to create a new file instead of overwriting the report file by selecting the copy and connect button
It’s now time to visualize our extremely complex measure. I’ll just make a card that covers the entire page and save the report file. Next, I’ll close the file and go back to my Power BI dataset file.
The next step is quite simple. We publish the dataset so that the updated version is also available in the Power BI service.
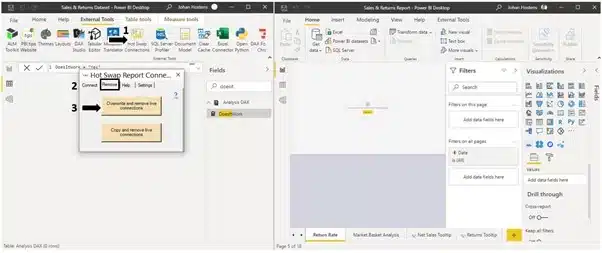
The modified dataset is ready to go. Time to update the report. In the dataset file in Power BI desktop, open the Hot Swap Report tool. Go to the Remove tab and select Overwrite and remove live connections. This opens a file dialog where we, once again, select the report file. The live connection will be removed and the report opens with errors in the visuals.
Just as we did before, we’ll create a new live connection to our dataset file in the Power BI service.
The visuals will re-appear and in the status bar you’ll see that the report file is connected to the service again.
Finally, the last step: Publish the report to the service. Hurray we’re done! You can check the updated report in the service now.
As a final note, I would like to mention another tool that can be installed with the Business Ops tool: The ALM toolkit. Among other things, this tool makes it possible to perform deployments of schema changes in Power BI Premium without needing to refresh the entire dataset. A good video about this can be found on the Guy In A Cube YouTube channel. The link to this video is added to the references.


