


Who has not created monitoring reports or beautiful dashboards in Power BI? Would it not be great to show off your work on the big screen in the office? But one static page is not very useful, and you do not want to manually refresh. It would be better to move through tabs or even several reports on a set interval. All of this is surprisingly simple with a free and easy to use extension called ‘Tab Rotate’, available in your Chrome browser.
Note: there are a ton of extensions out there that do similar things, some specifically for Power BI reports. I have just found this extension to be easy as well as free and stable. It meets my needs today but if you need more features, have a good search in the extension library.
First things first: install the extension Tab Rotate.
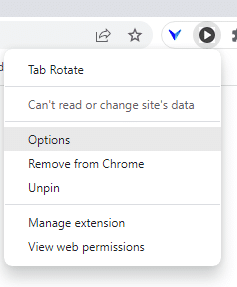
Right click on the Option menu of the extension to set up your loop.

The general settings are self-explanatory but if you want a finished look, I recommend setting full screen to true.
The most important part is the JSON array “websites”. Add the link to your report tab and add “?chromeless=1” here. See the example below.
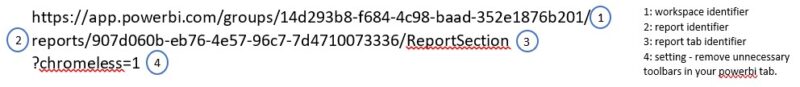
Obviously, you need to be logged in on Power BI with an account that has access to these reports. Once logged on, you are free to mix and match whatever reports, SharePoint pages, website pages, or other content, you want to include.
Set up the duration of each URL and enter the interval at which the tab will be reloaded. For example, if you do not need to reload, set the value to 0. If you need to reload it every 6 hours, set the value to 360. It all depends on the frequency of your dataset refresh, so use your common sense here.
Click save to persist your settings.

Now you only need to start the extension by clicking the “start” button and show off your beautiful dashboards.


