


Not so long ago a client asked me to rebuild a report of theirs in Power BI. It contained the top 5 countries ordered by number of visitors and … an Other group at the end. Like this for example:
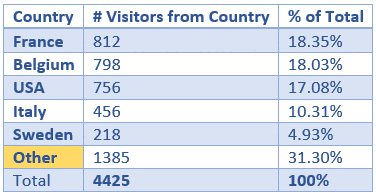
While this may look trivial, the following situations need to be handled for a top 5:
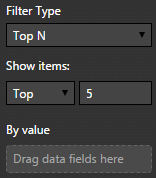
At first, I thought it could not be that hard, especially since one of the latest Power BI updates (October 2016) contained a Top N filter:
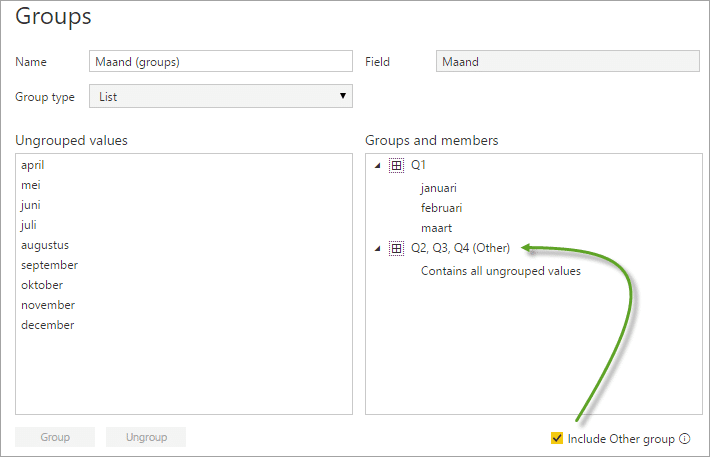
Further on, that same update added the possibility to group data. The Groups option even contained an Include Other group checkbox.
I assumed that a combination of these new features would get me to an Other group in the ranking. Well, it seems I was wrong: it was not that easy at all. The new Top N feature does not give a direct grip on an Other group. But by using the RANKX DAX function and the new grouping feature I reasoned it would work. Alas, the assumption was wrong because groups can only be made from columns, not from measures. So there was no dynamic grouping.
In a second attempt, I tried to create a calculated table with the SUMMARIZE and ADDCOLUMNS function. Of course, I should have known this, a calculated table is not re-calculated every time you change the filter context. Time to try another approach.
To start, we need a straightforward measure that sums the visitors:
SumVis = CALCULATE(SUM(Visitors[NrOfVisitors]))
Then, create a measure that totals all visitors, except the ones in the top 5. We use the EXCEPT and the TOPN function to accomplish this goal:
SumOther = CALCULATE([SumVis], EXCEPT(
ALL('Countries'[Country_]),
TOPN(5, ALL('Countries'[Country_]), [SumVis])
))
Knowing how to calculate the Other group is already an important step towards the solution. We will however not use the SumOther measure directly, but will use this logic in a few moments in some other measures.
What we also need is the actual ranking. We use the RANKX function for that:
Rank =
VAR Ranking = CALCULATE(
RANKX(ALLSELECTED('Countries'[Country_]),
[SumVis])
)
-- Be aware that, when a country is not having visitors,
-- it will return BLANK() as its ranking value.
RETURN
IF(
HASONEVALUE('Countries'[Country_]),
(Ranking*1000) + MIN(Countries[CountryID]),
BLANK()
)
Note that we multiply the ranking with 1000 and then add the ID of the country. The ID of the country is always lower than 1000. By using this logic, we can deal with ties in the 6th place. Subsequently, we’re interested in the lowest ranking that is not within the top 5:
MinRanking6 = CALCULATE(MINX(EXCEPT(
ALL('Countries'[Country_]),
TOPN(5, ALL('Countries'[Country_]), [SumVis])
),[Rank]))
Later on, we will use this value as a filter condition in another measure. We need to keep in mind that it can return a BLANK value, if no 6th in rank exists.
What’s tricky is how we will rename the 6th country in the rank with Other. Rankings that are even lower will be labeled Others instead of Other, so we can filter on them in the visual. That’s where we need the measure MinRanking6 for: if the ranking is equal to the value of that measure, it will be renamed to Other. If it’s smaller (better in rank), it will be set to the actual country, unless there’s more than one value for the country, as in the total line, and then it will not show anything (Blank). Take a look at the measure Country:
Country =
VAR MinRanking = IF([MinRanking6] = BLANK(), 500000, [MinRanking6])
RETURN
IF(
[Rank] = MinRanking,
"Other",
IF([Rank] > MinRanking, "Others",
IF(
HASONEVALUE(Countries[Country_]),
LASTNONBLANK(Countries[Country_], 1),
BLANK()
)))
If you look at how we defined the first variable, MinRanking, then notice that we first check if the measure MinRanking6 is Blank(). As said before, this measure will be blank if there is no 6th in rank. In that case, we give the variable an artificial high value, 50000 in this case (in practice give it a value that is higher than any plausible ranking value). We know that the measures Minranking6 and Rank will both be blank for countries that have no ranking, so that’s why we overrule the value of the measure when it’s blank. At this stage, we’ll get an intermediate result like this one:

As you can see, the country in the 6th rank is translated to Other, the countries ranked even lower have the value Others.
In the resulting table, we cannot just leave out the column Country_, as that would make our country measure inaccurate for this request. So, what is the biggest workaround in my opinion? Hide that column by dragging the width to its minimum. And for the measure Rank you will probably want to hide it as well, but because it is needed for sorting we hide it the same way (if we sort on the number of visitors while the Other section is bigger than one of the top-5 countries, the Other group will not be at the bottom, so therefore we need to order by Rank). Place the columns you want to hide in the beginning to get the best visual result.
In the final measure, we will create two variables, one for the total of the Other group, and one measure that totals all visitors. If there’s more than one value, we will show the total. In the other case, we will first check if the range is bigger than 6000 (6th in rank or higher). If it is, we will give it the value of the Other group, if it’s not, it will be the regular sum:
Visitors (#) =
VAR SumVisOther = CALCULATE([SumVis], EXCEPT(
ALL('Countries'[Country_]),
TOPN(5, ALL('Countries'[Country_]), [SumVis])
))
VAR SumVisAll = CALCULATE([SumVis], ALL(Countries[Country_]))
RETURN
IF(
HASONEVALUE(Countries[Country_]),
IF ([Rank] >= 6000, SumVisOther, [SumVis]),
SumVisAll
)
To show the percentage of the total, we just need to divide the calculated sum by the overall total:
Visitors (%) =
[Visitors (#)] / CALCULATE([Visitors (#)], ALL(Countries[Country_]))
The very last step is to add a visual filter on the Country. We filter Others and Blank values (so they’re not included).

The final result looks like this:
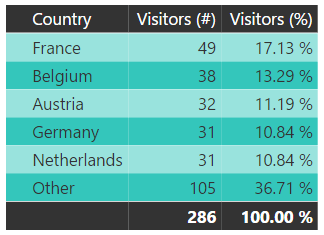
It looks easy when you first think about it, but to actually calculate an Other group and display it in a regular table is not that easy in Power BI (using the Matrix visualization would make the grouping slightly easier). But still, when we use the EXCEPT DAX function combined with some tricks, we’re able to complete the challenge with a regular Table visualization.
Future Power BI updates might make this task less challenging:
• Dynamic calculated tables
• A Top N filter with a built-in Other group
• Grouping on measures
• …
If you prefer a top 10 instead of a top 5, you will have to change the 5 into a 10 in a few measures. That being said, it would be useful if we could define global variables in DAX.
You can download the pbix file here, so you can test this approach yourself. It uses an R script as a data source.

Crafted by ![]()
Crafted by ![]()


