


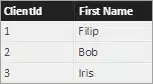
Not so long ago, I was working with a client who had a specific Power BI request. They wanted to do a lookup of a column in another table, but if there were multiple hits, they wanted to display all the matching rows in the same cell (Power BI doesn’t really know the concept of cells, but you know what I mean). Let’s give you an example. Imagine we have a very simple Clients dimension table with only three clients:
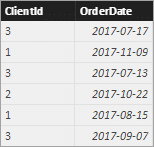
And an Orders fact table with these clients’ orders (clients can, of course, have multiple orders):
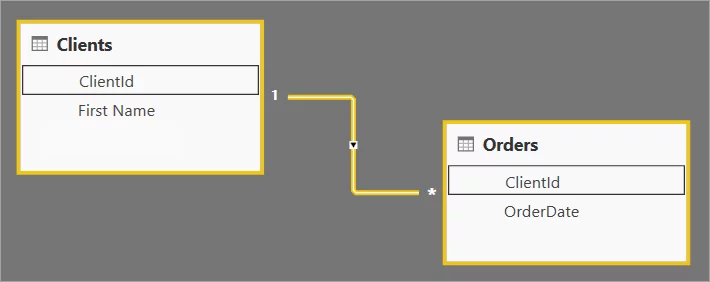
The model is as simple as the tables:
Now, what the client wanted to achieve was this:

Why?
At first, I was somewhat hesitating to look for a solution. What’s wrong with multiple rows (one for each order date). And let’s say we put all order dates in one cell, how will it look when you try to squeeze 50 order dates in one cell!? Well, the business of the client was different, so from a visual point of view, a maximum of four values could show up in a cell, but usually no more than one or two. The second reason to solve this was that the technical me wanted to know how to achieve this.
It doesn’t always have to be difficult
When starting to search for a solution, I wasn’t sure I would actually find one. And then I found out that there is a CONCATENATEX function in Power BI (it’s also available in SSAS 2016 and Power Pivot in Excel 2016). It simply concatenates the result of an expression, and you can even choose your delimiter and sort order (but the sort order isn’t properly documented at the time of writing).
So, let’s take a look at the solution. This is the DAX formula for the calculated column in the Clients table:
Order Dates =

CONCATENATEX(

FILTER(Orders; Clients[ClientId] = Orders[ClientId]);

FORMAT(Orders[OrderDate]; "yyyy/mm/dd");

", ";             // the delimiter

Orders[OrderDate] // sort ascending by order date

)
So, we look for all the matching records in the Orders table and we concatenate the order dates of these records. When displayed in a report it looks like this:
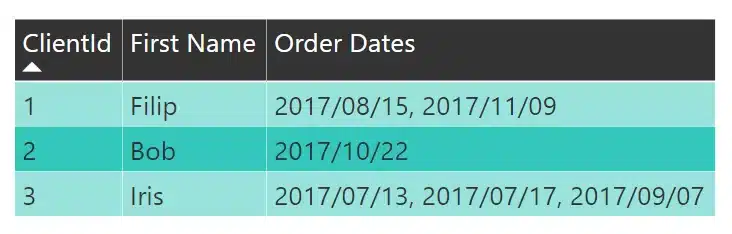
Simple, but very helpful in certain cases.

Crafted by ![]()
Crafted by ![]()


